Choosing the right error metric for your predictive model

Want to learn what to consider when choosing an error metric for your machine learning model? Read this post I wrote on Cardinal Path’s blog!

The main considerations are:

  • Do we want to punish overestimates or underestimates more heavily?
  • Are there segments which have greater costs associated with incorrect predictions?
  • Should we punish larger errors or smaller errors more heavily?

Learn more here.

My Favorite R Packages

Me and some colleagues talk about our favourite R packages over on the Cardinal Path blog. Here is one of mine:

googlesheets

The R package googlesheets is an easy to use way to access and manage Google Sheets through R. I like being able to connect directly to data stored in a Google Sheet because when I pass my R program to someone else, the data source (from a URL) is the same. Also, since Google Sheets can be shared with anyone the results from my programs that have been output to Google Sheets will automatically update so that everyone will be looking at the most up to date version without having to email new files to people. I love that it works with the pipe operator (%>%) so a lot of the operations are intuitive to use if you are familiar with using dplyr.

I also frequently use dplyr, caret, and forecast. What are your favourite R packages?

Read the original post to learn about some other great R packages.

How to Best Use Customer Lifetime Value Analysis Results

Check out my post on how to action the results from a customer lifetime value model from the Cardinal Path blog! No matter what analysis or model you are doing for a business, it is all useless if the model doesn’t get used. Learning what decisions can be influenced by what approach will help drive your business to improve ROI and use data for organizational change!

A customer lifetime value (LTV) analysis is the best way to figure out which type of customers provide the most value to your business.

An LTV analysis attempts to predict the value that a customer brings to your business over their whole customer life cycle. That is, how long will they remain a loyal customer, and when are they likely to churn? How much money will they spend with your business, and how often? What are the acquisition costs associated with this customer?

We can use both traditional statistics and financial techniques in order to answer these questions, but once you have  this information, how will you take action on it?

You can learn how to take action from the original post here.

Sharing Your R Code

I love R  and I love sharing! Read my post on Cardinal Path’s blog for tips on how to share your R code with others.

I’ve written a couple of posts in the past about the programming language ‘R’, which is used to help predict outcomes and measure the impact of certain actions on your business goals. R also very useful in making large tasks more manageable, repeatable, and semi- automated. In this post, I’d like to outline the best ways to share your R code. There are many reasons for writing functions and sharing your code.  This post will provide a brief introduction into how you would carry out these tasks, using examples to showcase why…

Check it out here!

Are You Spending Too Much?

Are you spending too much on online advertising? Find out how to answer this here. In this post I wrote on the Cardinal Path blog, I explain how diminishing returns can be used to optimize your spending budget.

As you are probably aware, every dollar spent on advertising does not generate equal return. When looking at how media spend performs within a channel  (paid search for example), there is a point at which a campaign starts to bring in less revenue than what was spent. This is known as the point of diminishing returns.

In the beginning, the money you spend on advertising for a certain channel will yield a  high return, since without it, there would have been no revenue generated from the channel at all. You usually have to spend a sufficient amount in order to maximize your gains from entering a particular channel. However, as you start to spend more and more, you will see these high returns begin to taper off at a certain point. Eventually, you will be spending $1, while realizing less than $1 in revenue. It is at this point where  you have hit the point of diminishing returns. Now would be the time to consider scaling back your investment in this channel…

Learn more here.

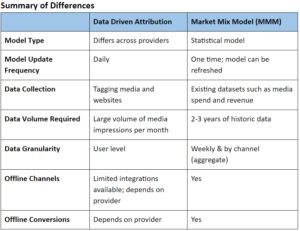
Data Driven Attribution or Media Mix Modelling?

Read this post I wrote on Cardinal Path’s blog to learn the difference between Attribution and Media Mix Modeling. It can be a bit confusing since they both seem to answer the same or similar questions, but depending on your business, one is probably better suited to your needs. This table from the post summarises the highlights:

It’s one of my most popular blog posts. Read on here!

Assessing a Data-Driven Attribution Solution

Is your organization thinking about attribution? Who should you choose to help you solve the attribution problem? I wrote this post on Cardinal Path’s blog to help you ask the right questions to get the best attribution vendor for you.

Data-driven attribution is used to determine which marketing channels have the largest impact on conversion. While rule- based attribution can be subjective, as you assign how much credit each channel gets depending on its position in the conversion path, data driven attribution leads to more objective results. This helps to determine which channels are driving the most conversions.

If you’re looking for an attribution solution, you may not even know where to begin. Are you aware of the types of attribution solutions the different providers offer? Are you even ready for an attribution model? What types of questions should you ask internally and to prospective vendors to ensure you get the best solution possible for your business needs?

In this post, we will review some of the key questions you should be asking when gauging the different attribution solutions. Think of this as an attribution procurement ‘pep talk’.

Learn more here.

Data Leakage: How Data Collection Impacts the Decisions We Make and Vice Versa

I wrote this post on Cardinal Path’s blog. There is a lot to consider when building a model: Data leakage.

Data leakage occurs when the data you are using to train a machine learning algorithm happens to include unexpected information related to what you are trying to predict, allowing the model or algorithm to make unrealistically good predictions.  In other words, since the data you are using to predict already contains the prediction, hidden in some variable,  the results of the model may not actually be useful.

For example, let’s say we’re trying to predict which customers made a purchase, and the dataset used to make the predictions contained a customer ID (which we assume to be random), but the customer ID started with a 1 if they made a purchase. We can now make a model with impeccable predictions (just use the rule if first digit = 1). However, these rules are actually useless. They don’t help to determine whether a new customer will make a purchase based on the rules that actually matter. Of course, this example is a bit ridiculous, since using a customer ID as a predictor in a model would be naive, but here are some more concrete examples of where this happens.

Read more here!

When all you have is a hammer, everything looks like a nail: choosing the right tool for the job

Check out this post that I wrote over on Cardinal Path’s blog that discusses finding the right tool for the job:

A few weeks ago, a coworker asked me for some help with a data cleaning task. I consider him to be one of the best Tableau users in our office, and someone I frequent when I get stuck on any Tableau problem. I, on the other hand, am much more comfortable solving problems in the statistical programming language R.

He described what he needed help with: changing underscores to hyphens, changing uppercase to lowercase, and mapping ‘messy’ values with typos to the ‘correct’ values. I started by visualizing the code that I would write for this using R, starting from the functions I would typically use, to the order of the logic. I then asked him what tool he had used to clean the data previously. He answered, “Tableau.”

When all you have is a hammer, everything looks like a nail. His preferred hammer is Tableau, my preferred hammer is R. In this case, the data cleaning was a sort of a one-off task, so the tools were pretty interchangeable. I have another coworker who I’m sure would use Analytics Canvas to solve such a problem, others that would use Excel- there are a plethora of different tools available to choose from.

However, there are many situations where one tool wins as the ‘right’ tool for a job, and using the right tool can lead to extreme time saving. Here are three considerations…

Read on here to get some tips on evaluating what program or tool you should use for a task!